Region, site, individual. Live.
One dashboard for the questions that matter: who has seen it, who has done it, and where the gaps are, across every location, in real time.
Read the room in sixty seconds.
Last month's printed report, replaced by the live dashboard: who's in the app, by region and store, what they read, who's seen it, who's done it, who hasn't, and down to one named person.
Adoption and engagement, not vanity numbers.
See who is in the app, what they read and where engagement is strong or slipping, by region, by site and by individual. Useful for comms teams; persuasive for boards.
- Adoption and engagement across the whole estate
- Drill down from region to site to named person
- Live, not last month's PDF
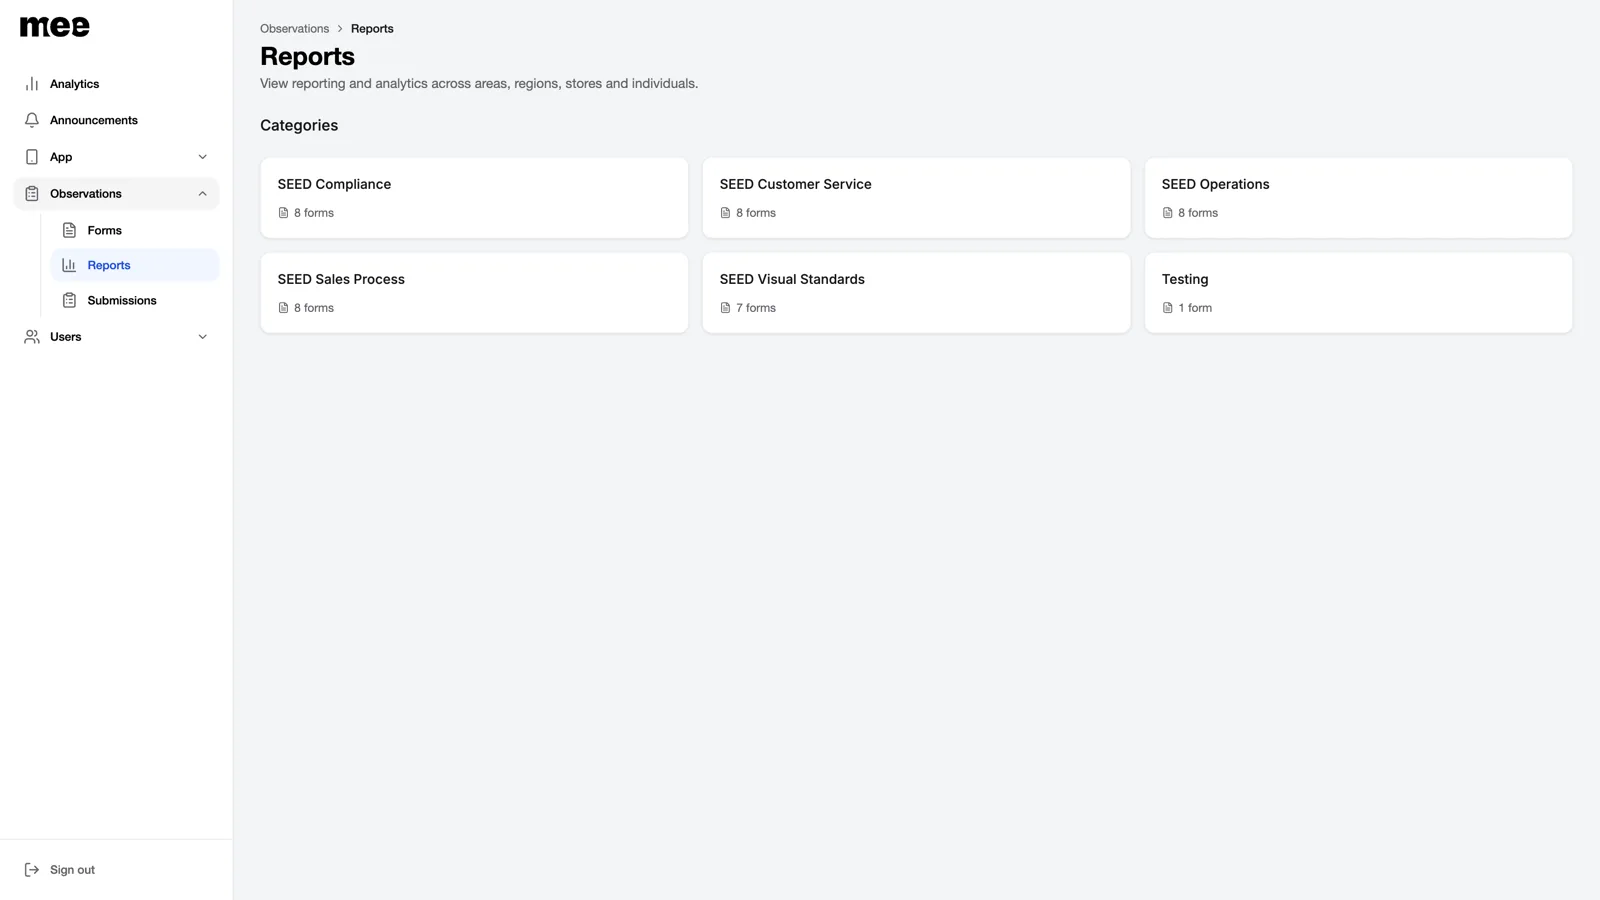
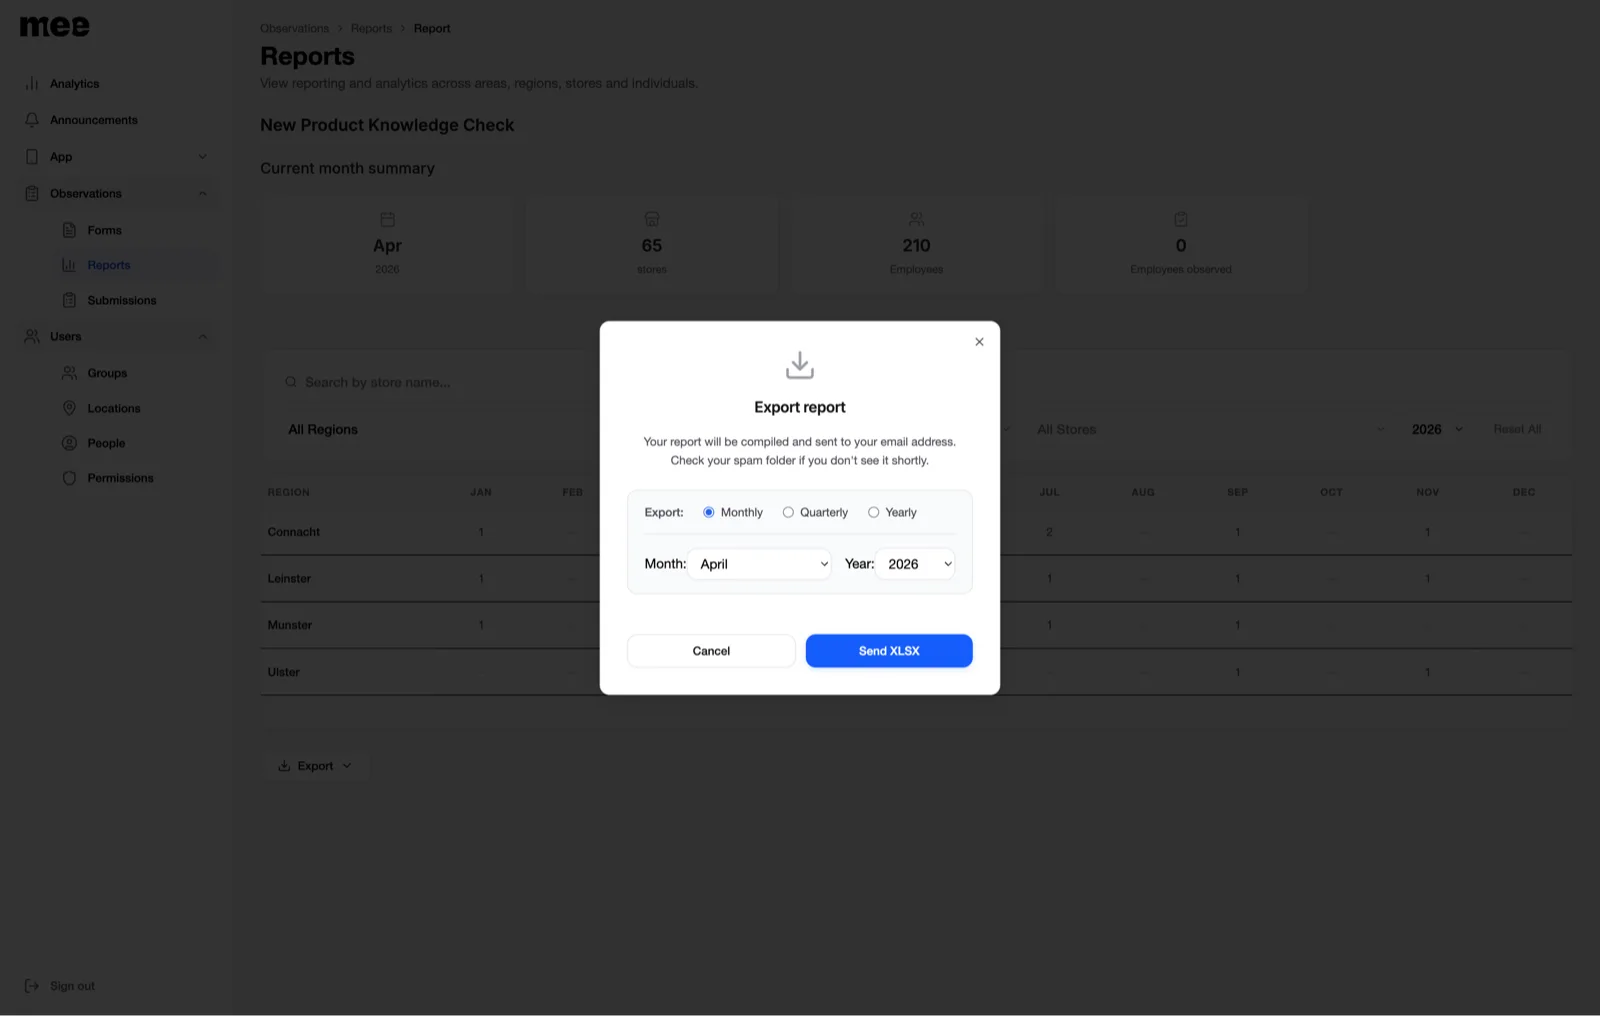
Operational reporting your auditors will love.
Every form submission is recorded against a named SSO identity and reported in the same dashboard: completion by site, missing checks, and the full response history. Export any of it as CSV for compliance reviews or your BI stack.
- Completion dashboards for every form and site
- Full response history with names and timestamps
- CSV export to Excel, Power BI and beyond
See more than just logins.
Beyond who has opened the app: what they are engaging with, how it trends over time, and where the drop-off happens.
Usage trends over time
Daily, weekly and monthly active users, with year-on-year comparisons so you can tell a real trend from a seasonal dip.
Content performance
Impressions, clicks and click-through rate for every carousel slide, quick link, page and news article, so you know what people actually engage with.
Engagement funnels
See where people drop off, from opening a form to submitting it, or from viewing a post to reacting and commenting.
Top and inactive users
Spot the sites and individuals driving engagement, and the ones who need a nudge, without waiting for a spreadsheet.
Reporting questions, answered.
Is the reporting live or delayed?
Live. Adoption, engagement and form completion update as they happen, so a dip is a this-week conversation, not a next-quarter surprise.
Where do the numbers come from?
From Mee itself. Every screen view, post, reaction and form submission is measured in the product and tied to a named SSO identity, so the figures are real activity, not survey estimates.
Can we take the data into our own BI tools?
Yes. Anything in the dashboard exports as CSV, straight into Excel, Power BI or a compliance pack. Deeper integrations are on the roadmap.
Ask us your hardest reporting question.
Book a demo and watch us answer it from the dashboard, live.